1000 Genomes analysis
The tree sequence files for 1kg are available here. The other metadata files are part of the public 1kg release.
[2]:
import os
import tskit
import numpy as np
import xsmc
import matplotlib.pyplot as plt
from concurrent.futures import ThreadPoolExecutor, as_completed, ProcessPoolExecutor
from xsmc.supporting.kde_ne import kde_ne
from xsmc.supporting.plotting import *
import logging
import os


logging.getLogger("xsmc").setLevel(logging.INFO)
PAPER_ROOT = os.path.expanduser(os.environ.get("PAPER_ROOT", "."))
[3]:
np.random.seed(1)


def seed():
    return np.random.randint(1, np.iinfo(np.int32).max)
[4]:
full_chroms = [tskit.load(f"/scratch/1kg/trees/1kg_chr{i}.trees") for i in range(1, 23)]
# chr1 = chr1.delete_intervals([[0, 16e6]], simplify=False).trim()
Accessibility masking
The 1kg tree sequences feature some trees that span huge intervals. These represent centromeres, telomeres, or other inaccessible regions. To our method they appear as huge tracts of IBD, leading to downward bias in the size history estimates. To properly correct for this we should use the 1kg accessibility masks, but here I adopt the simpler approach of heuristically chopping out trees that span large segments (>1Mb).
[5]:
long_spans = {}
for i, chrom in enumerate(full_chroms, 1):
    long_spans[i] = [t.interval for t in chrom.trees() if np.diff(t.interval) > 1e6]
long_spans
[5]:
{1: [Interval(left=121347335.0, right=142643153.0)],
 2: [Interval(left=90490322.0, right=91634056.0),
  Interval(left=92102205.0, right=95333904.0)],
 3: [Interval(left=90291128.0, right=93527692.0)],
 4: [Interval(left=49629442.0, right=52700457.0)],
 5: [Interval(left=46118241.0, right=49571959.0)],
 6: [Interval(left=58665913.0, right=61967504.0)],
 7: [Interval(left=57669630.0, right=62465883.0)],
 8: [Interval(left=43529404.0, right=47458633.0)],
 9: [Interval(left=47309856.0, right=65510886.0)],
 10: [Interval(left=39043557.0, right=42746452.0)],
 11: [Interval(left=50381334.0, right=51436554.0),
  Interval(left=51510699.0, right=55254669.0)],
 12: [Interval(left=34340941.0, right=38610698.0)],
 13: [Interval(left=0.0, right=19037838.0)],
 14: [Interval(left=0.0, right=19083007.0)],
 15: [Interval(left=0.0, right=20253797.0)],
 16: [Interval(left=35146682.0, right=46554124.0)],
 17: [Interval(left=22155426.0, right=25392232.0)],
 18: [Interval(left=15357425.0, right=18535477.0)],
 19: [Interval(left=24310556.0, right=28366182.0)],
 20: [Interval(left=26193540.0, right=29862565.0)],
 21: [Interval(left=0.0, right=9491942.0),
  Interval(left=11010799.0, right=14383028.0)],
 22: [Interval(left=0.0, right=16103536.0)]}
Now we simply chop these intervals out. This technically allows IBD tracts to span these gaps during inference, but the effect should be minimal.
[6]:
chroms = [
    chrom.delete_intervals(long_spans[i], simplify=False).trim()
    for i, chrom in enumerate(full_chroms, 1)
]
[7]:
# 1kg metadata

with open("/scratch/1kg/integrated_call_samples_v3.20130502.ALL.panel", "rt") as f:
    next(f)
    rows = (line.strip().split("\t") for line in f)
    sample_map = {sample_id: (pop, superpop) for sample_id, pop, superpop, _ in rows}
[8]:
# map each 1kg sample id ts nodes
import json

samples_to_nodes = {
    json.loads(ind.metadata)["individual_id"]: ind.nodes
    for ind in chroms[0].individuals()
}
[9]:
superpops = {}
for sample_id, (p, sp) in sample_map.items():
    superpops.setdefault(sp, [])
    superpops[sp].append(sample_id)
[10]:
K = 20  # number of samples to take from each superpopulation
mu = 1.4e-8  # assumed mutation rate for humans


def process_samples(sample_dict, w, rho_over_theta):
    sampled_heights = {}
    lines = {}
    for sp in sample_dict:
        print(sp, flush=True)
        xs = []
        for sample_id in sample_dict[sp][:K]:
            print("\t%s" % sample_id)
            f, p = samples_to_nodes[sample_id]
            for data in chroms:
                xs.append(
                    xsmc.XSMC(
                        data, focal=f, panel=[p], w=w, rho_over_theta=rho_over_theta
                    )
                )
        with ThreadPoolExecutor(24) as p:
            futs = [
                p.submit(
                    x.sample_heights,
                    j=100,
                    k=int(x.ts.get_sequence_length() / 50_000),
                    seed=seed(),
                )
                for x in xs
            ]

        sampled_heights[sp] = np.concatenate(
            [f.result() * 2 * x.theta / (4 * mu) for f, x in zip(futs, xs)], axis=1
        )  # rescale each sampled path by 2N0 so that segment heights are in generations
    return sampled_heights
Time to process 1 whole genome
[11]:
%%time
_ = process_samples({'test': ['NA12878']}, w=500, rho_over_theta=1.)
test
        NA12878
CPU times: user 7min 36s, sys: 743 ms, total: 7min 37s
Wall time: 37.8 s
Main event
Run pipeline for all 1kg samples split into 5 superpopulations
[12]:
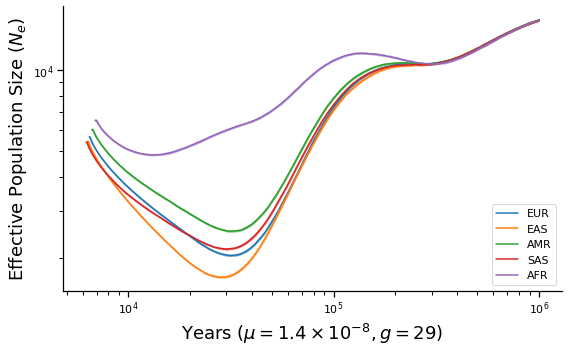
def make_plot(sampled_heights, g, name):
    fig, ax = plt.subplots(figsize=(8, 5))
    x0 = np.geomspace(1e2, 1e6, 1000)
    for sp, col in zip(sampled_heights, TABLEAU):
        lines = []
        A = np.array(sampled_heights[sp])
        with ProcessPoolExecutor() as p:
            futs = [p.submit(kde_ne, a.reshape(-1)) for a in A]
            for f in as_completed(futs):
                x, y = f.result()
                lines.append((x * g, y / 2))  # rescale to years, plot diploid Ne
        plot_summary(ax, lines, x0, color=col, label=sp)
    ax.set_xscale("log")
    ax.set_yscale("log")
    ax.legend(loc="lower right")
    ax.set_xlabel(r"Years ($\mu=1.4\times 10^{-8}, g=%d$)" % g)
    ax.set_ylabel("Effective Population Size ($N_e$)")
    fig.tight_layout()
    fig.savefig(os.path.join(PAPER_ROOT, "figures", "xsmc_1kg_%s.pdf" % name))
    return fig
[13]:
%%time
sampled_heights = process_samples(superpops, w=500, rho_over_theta=1.)
EUR
        HG00096
        HG00097
        HG00099
        HG00100
        HG00101
        HG00102
        HG00103
        HG00105
        HG00106
        HG00107
        HG00108
        HG00109
        HG00110
        HG00111
        HG00112
        HG00113
        HG00114
        HG00115
        HG00116
        HG00117
EAS
        HG00403
        HG00404
        HG00406
        HG00407
        HG00409
        HG00410
        HG00419
        HG00421
        HG00422
        HG00428
        HG00436
        HG00437
        HG00442
        HG00443
        HG00445
        HG00446
        HG00448
        HG00449
        HG00451
        HG00452
AMR
        HG00551
        HG00553
        HG00554
        HG00637
        HG00638
        HG00640
        HG00641
        HG00731
        HG00732
        HG00734
        HG00736
        HG00737
        HG00739
        HG00740
        HG00742
        HG00743
        HG01047
        HG01048
        HG01049
        HG01051
SAS
        HG01583
        HG01586
        HG01589
        HG01593
        HG02490
        HG02491
        HG02493
        HG02494
        HG02597
        HG02600
        HG02601
        HG02603
        HG02604
        HG02648
        HG02649
        HG02651
        HG02652
        HG02654
        HG02655
        HG02657
AFR
        HG01879
        HG01880
        HG01882
        HG01883
        HG01885
        HG01886
        HG01889
        HG01890
        HG01894
        HG01896
        HG01912
        HG01914
        HG01915
        HG01956
        HG01958
        HG01985
        HG01986
        HG01988
        HG01989
        HG01990
CPU times: user 15h 50min 50s, sys: 32.1 s, total: 15h 51min 22s
Wall time: 41min 10s
[14]:
make_plot(sampled_heights, 29, "final")
/home/terhorst/opt/py37/lib/python3.7/site-packages/numpy/lib/nanfunctions.py:1392: RuntimeWarning: All-NaN slice encountered
  overwrite_input, interpolation)
2020-09-21 16:03:00,023 WARNING matplotlib.font_manager MainThread findfont: Font family ['sans-serif'] not found. Falling back to DejaVu Sans.
2020-09-21 16:03:00,225 WARNING matplotlib.font_manager MainThread findfont: Font family ['sans-serif'] not found. Falling back to DejaVu Sans.
[14]: